A full trade workspace — and the signals to use it.
Pro-grade charts, an options chain with a strategy builder, AI research and a Liquidity Strength Meter — paired with a proprietary scanner that delivers real-time alerts to Discord and the app, and an AI assistant that looks things up for you. Trade with the market, not against it.
Start Free 7-Day Trial →Chart-first workspace
Charts, options, AI — in one place
Real-time alerts
Via Discord instantly
Transparent results
Graded, published track record
On the right side
Built on market sentiment
A chart-first research desk — free to every member
Everything you need to size up a name lives on one page: a fast proprietary chart, the full options chain with a strategy builder, AI research, order-flow, and a risk-first trade planner. Think TradingView-lite — but built around our signals.
Proprietary charts
Fast in-house candles + volume, live-synced to the real price, in light or dark.
24 indicators
EMA, VWAP, RSI, MACD, Ichimoku, SuperTrend and more — all editable, save as templates.
Drawing toolkit
Trend lines, zones, Fibonacci, and a position tool with R:R — draggable and editable.
Order-flow (DeltaFlow)
See buy vs sell volume at every price — who's really in control of the move.
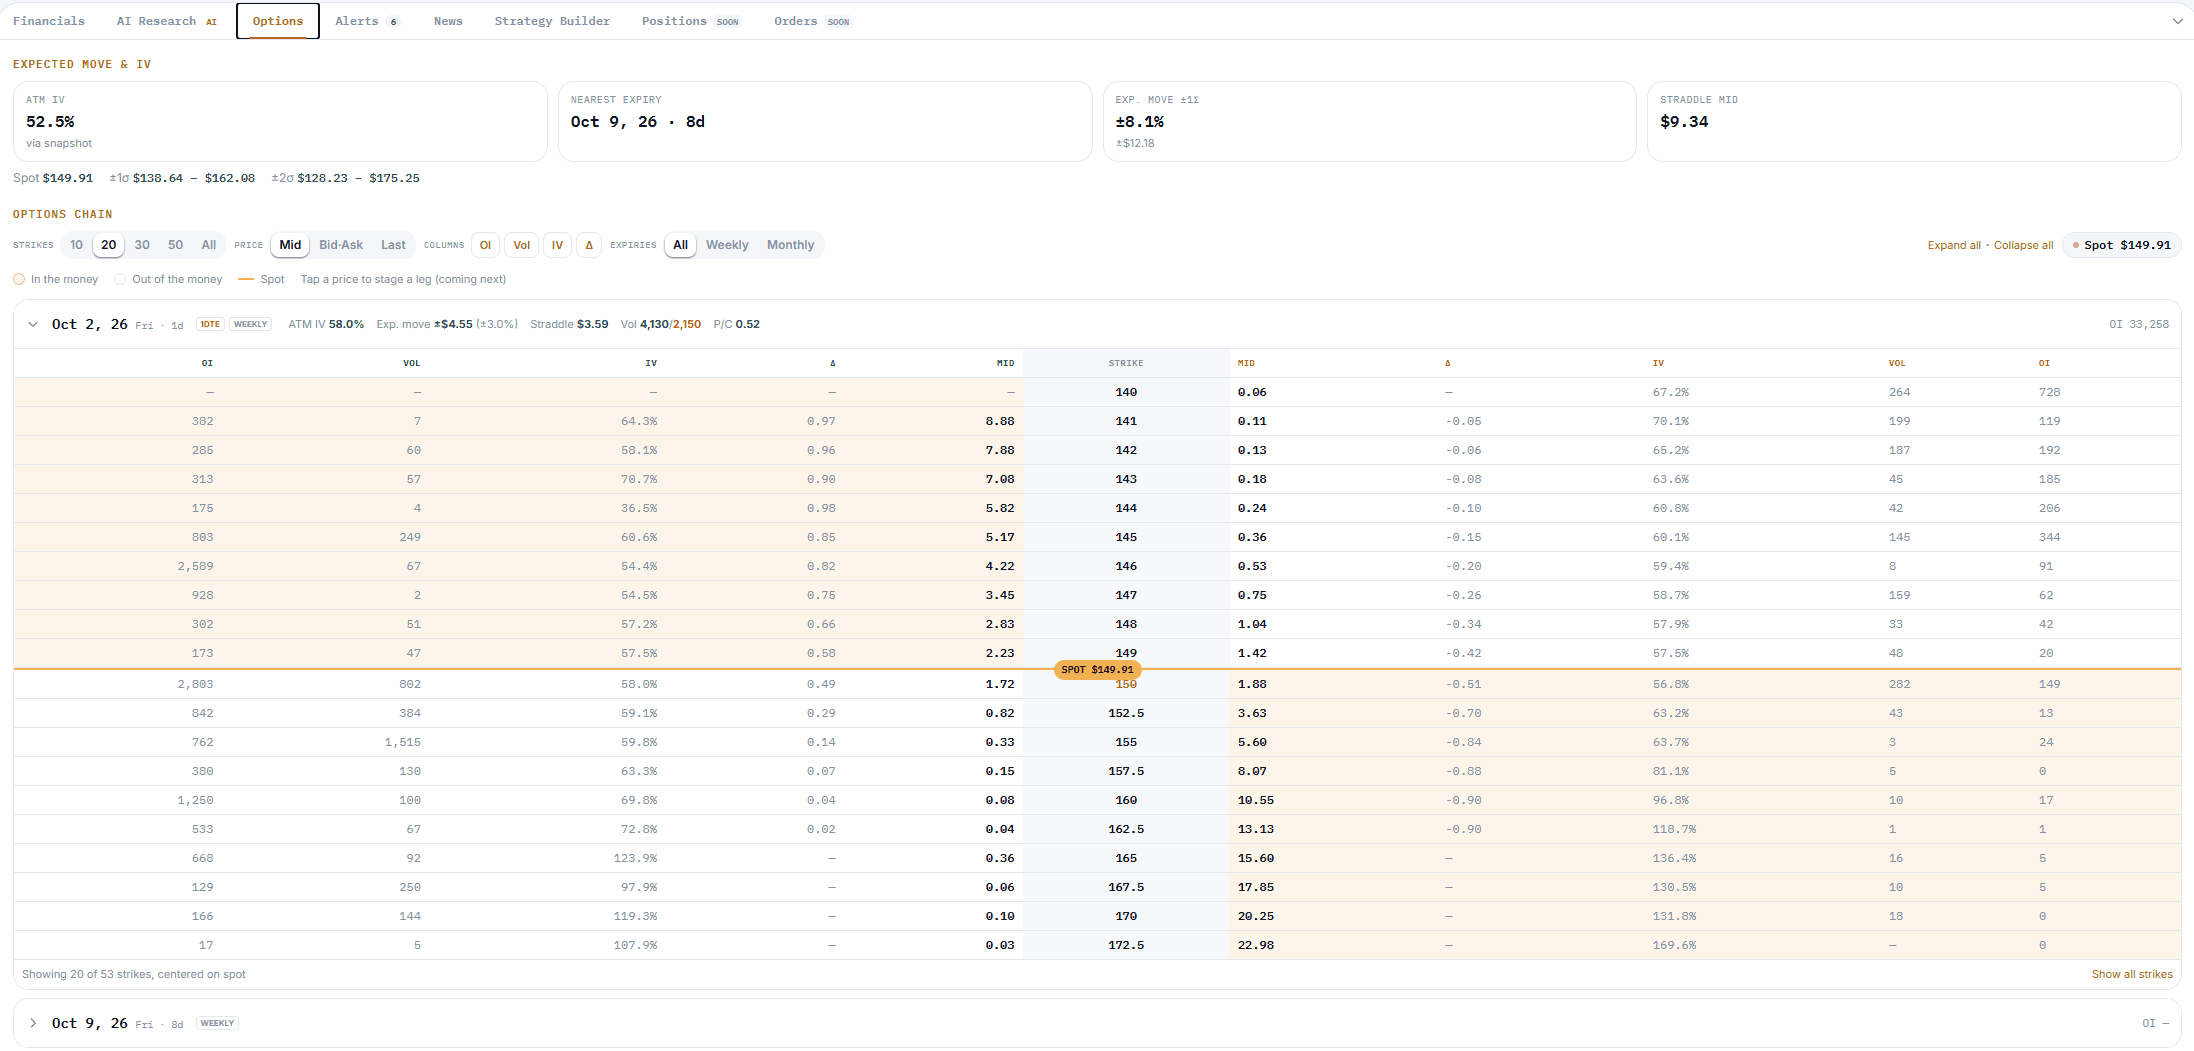
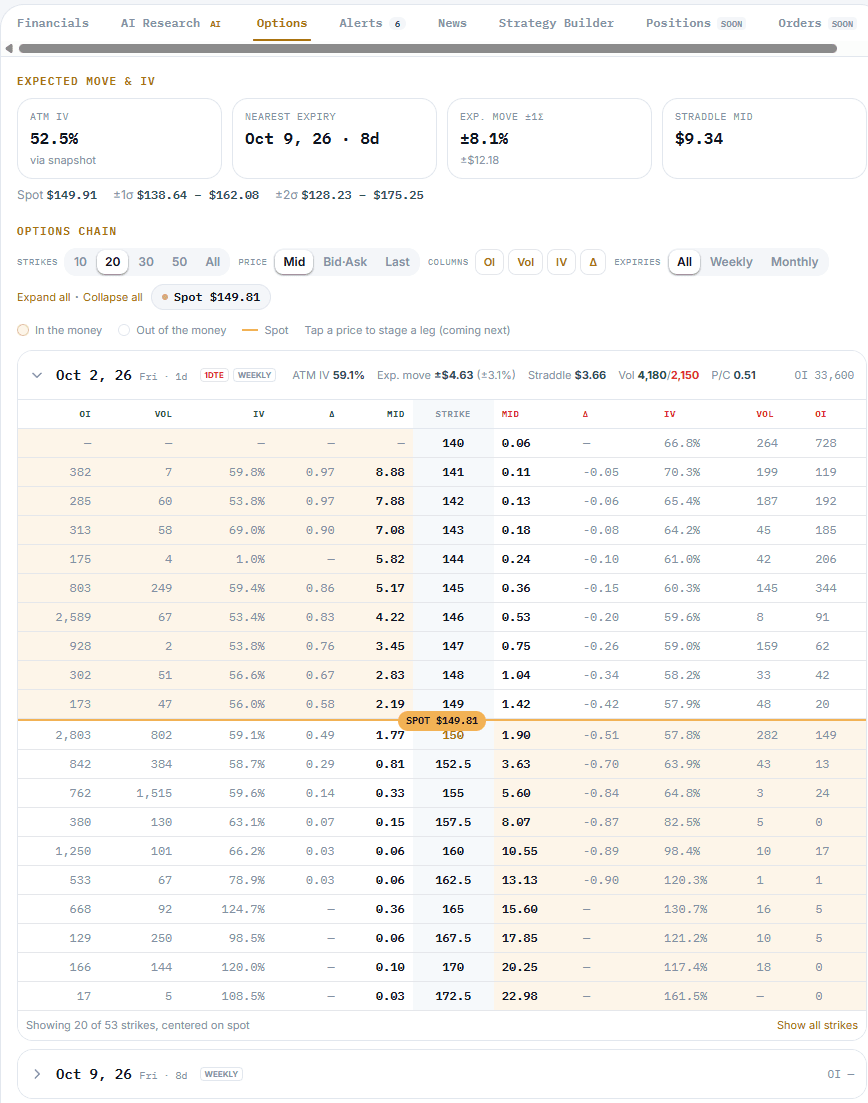
Options chain
Full Call | Strike | Put chain with ITM shading, live spot, IV, greeks and open interest.
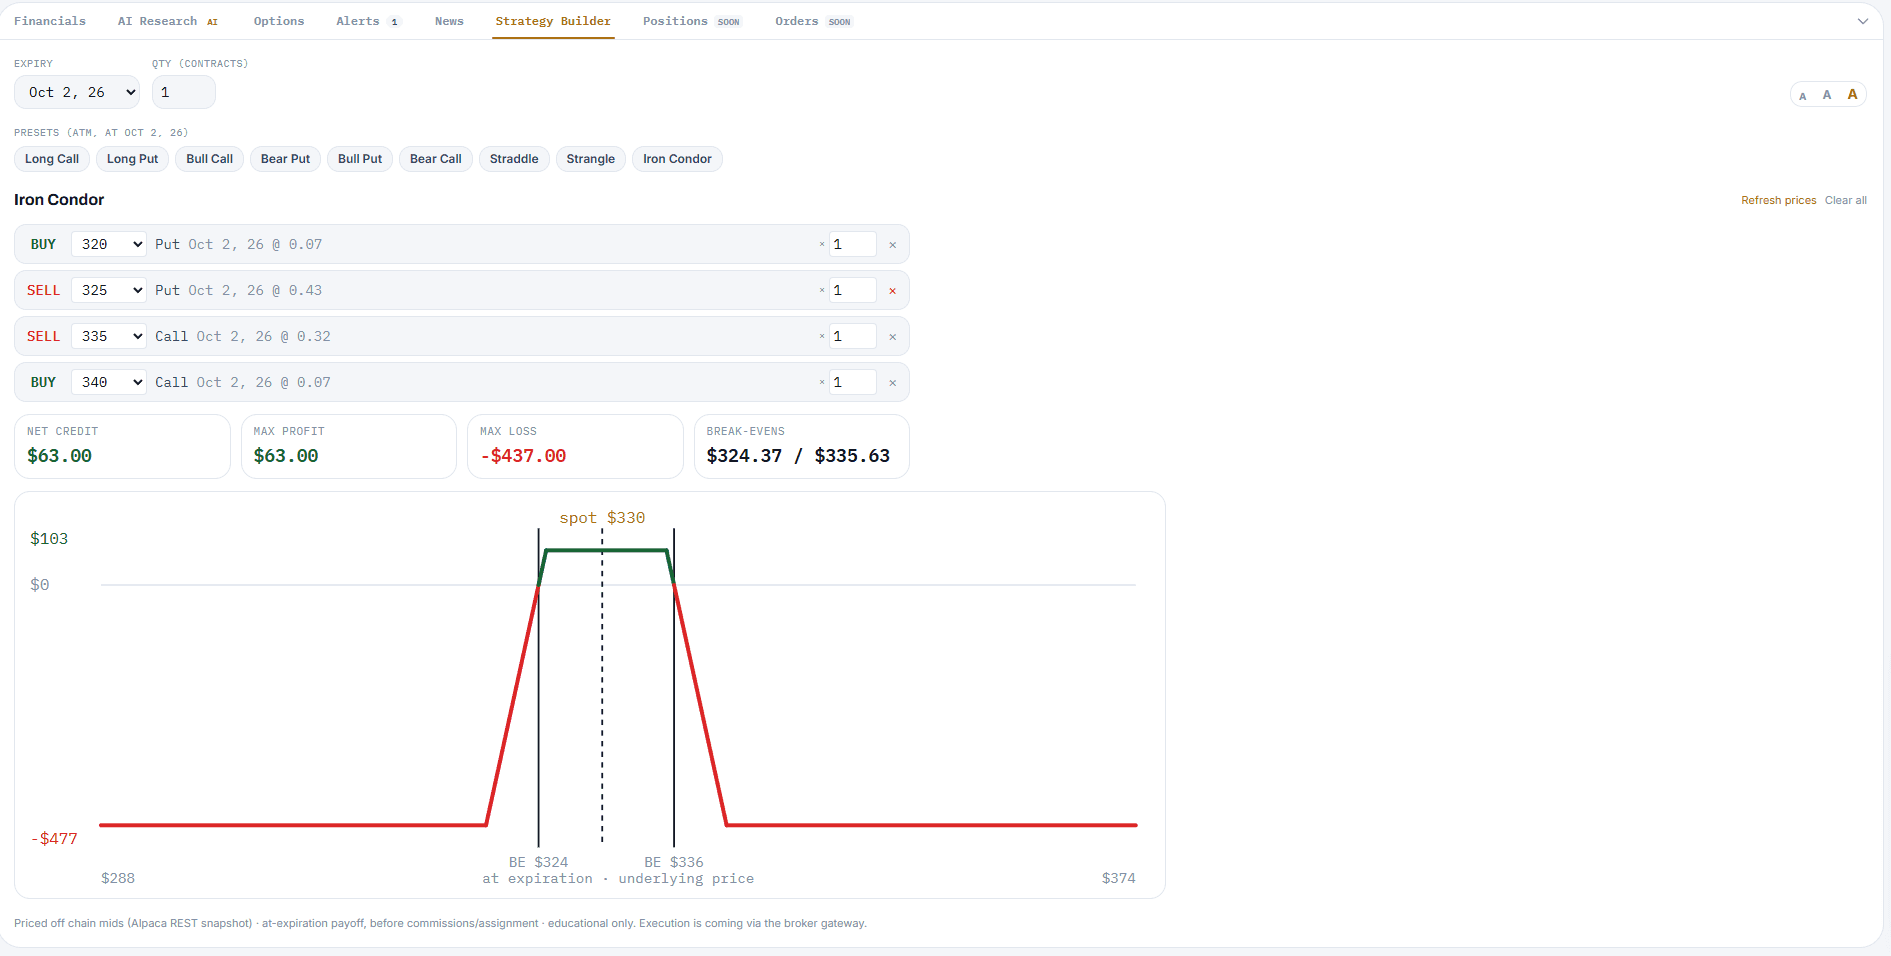
Strategy Builder
NewTap prices to build spreads; instant max profit/loss, break-evens and a payoff diagram.
AI research
A grounded AI thesis per symbol: bias, key levels, catalysts, risks and invalidation.
Trade Planner
Risk-first ticket: set entry, stop and target; it auto-sizes from your dollar risk and shows R:R.
Expected-move cone
The options market's ±1σ/±2σ range to the next expiry, projected right on your chart.
Chart price alerts
Click a level to get pinged when price crosses it — with your own alert sound.
Watchlists
Track your names with live quotes beside the chart and from anywhere in the app.
Every timeframe
13 timeframes from 1-minute to weekly, with quick ranges from 5 days to 5 years.
Financials & company data
Financials, company profile, insider trades and technicals in tabs right under the chart.
Volume profile & key levels
See where the most volume traded, auto-drawn support/resistance, and insider + earnings markers on the chart.
Earnings & economic calendar
NewWho reports this week (before the open or after the close), any company's next date by search, plus the key US economic releases.
The options desk, right in your browser
A proprietary scanner, delivered the moment it triggers
Our scanners are tuned to market sentiment, so you find yourself on the right side of the trade more often — and we refine them continuously. Alerts reach you instantly in Discord and the app.
MoSoG Bot
🚨 ALERT: $NVDA Bullish breakout — Entry $420 | Target $490 | Stop $395
MoSoG Bot
📊 End of Day: $NVDA +16.2% | $AMD +8.4% | $TSLA +5.1%
Trader1
In on NVDA at $421 — thanks! 🔥
Proprietary scanner
Market-sentiment scans across stocks and options — on the right side of the move.
Real-time delivery
Alerts hit the app and Discord the moment our scanners trigger — no refresh.
End-of-day summary
Every trading day, the % move on all alerts — options and stocks — posted after the close.
My price alerts
Set personal above / below / cross alerts on any ticker, with email delivery.
3-month history
A full, searchable history of every alert your plan entitles you to.
Transparent track record
Graded, published results — we lead with proof, not promises.
Live alerts feed
Today's alerts as they fire, with filters for scan, long/short, stocks vs options, strength and session — repeat hits grouped.
How to trade each alert
A plain-English guide for every alert type: what it's looking for and how long trades typically run.
Browse your full alert history, filter by scan, and see graded results on the public track record →
Read the market like the desks do
Two analytics you won't find bundled anywhere at this price: a plain-English strength read on any symbol, and a dealer-positioning heat map that shows where price gets pinned.
One clear read — long vs short, 0 to 100
For any stock, our engine reads the market in real time and scores its Long Strength and Short Strength — so you see at a glance whether a name looks poised to push higher, roll over, or stay rangebound.
- Long & Short strength scored 0–100, updated through the session
- A clear directional bias with a confidence rating
- Setup stage — know when a move is building vs confirmed
- Works on any symbol: alerts and your own watchlist
Strong upside conviction — trend, structure, and live participation are aligned, with the setup confirmed.
Illustrative — live snapshot refreshes daily after the close.
GEX/VEX Dealer Heatmap
The biggest players don't guess where a stock stalls or rips — they see it in the options. Now you can too. Our heatmap maps dealer gamma and vega by strike, exposing the magnets that pin price, the ceilings rallies fade into, and the floors that catch dips.
- Call & put walls: where rallies stall and dips get caught
- Gamma flip: know when the tape mean-reverts vs trends
- A plain-English playbook — what to do at each level
- SPY · QQQ · IWM · DIA, refreshed daily after the close
Ask Guru. It looks it up for you.
Our AI assistant lives on every page. Ask a question in plain English and Guru answers instantly, and when the answer needs live data it goes and gets it, then links you straight to the full page.
- “Any alerts on TSLA today?” The alerts your plan includes, with a link to the full list
- “When does NVDA report?” The next earnings date and EPS estimate
- “What’s AAPL trading at?” A live quote with a link to its chart
- Questions about plans, features or getting started, answered on the spot
- Need a person? Our team can step into the same chat
Guru explains and finds information. It never gives personal investment advice.
Guru
Questions about alerts, plans or the platform? Ask away.
Any alerts on NVDA today?
Yes, NVDA has 2 alerts today. They're listed below, with a link to the full page.
Open all NVDA alerts →
Illustrative example.
Bolt on more edge when you want it
Specialist tools you can add to any plan — pay only for what you use.
Recommended hedge
Buy 2× $185 Put · ~45 DTE
Trigger
signal + regime
Est. cost
~1.1% of pos.
Protects to
$168
Your AAPL position started to turn while the broader market went risk-off. Here's a tested way to protect it — ride the dip, keep the shares.
Illustrative example — not a live recommendation.
Portfolio Hedge Monitor
Most portfolio “protection” quietly loses money — you pay for puts month after month while the market drifts higher. The Hedge Monitor watches your actual holdings and only flags a hedge when a position rolls over and the market turns risk-off.
- Monitors your real holdings every day
- Alerts when a position turns and the market goes risk-off
- Hands you a tested hedge: structure, strikes, cost, playbook
- Tells you when a dip is just a dip — so you don't over-hedge
Polished, fast, and built for how you work
Light & dark theme
The whole app in a polished light or dark theme — switch anytime, we remember your choice.
Your dashboard, your way
A drag-arrangeable widget grid — alerts today, win rate, top setups, expiring options and more.
Private Discord
Real-time alerts, EOD summaries, how-it-works, indicators, ThinkorSwim templates and community.
Notifications your way
Choose in-app, email or SMS per alert type and pick custom alert sounds.
Pre-Market Brief & Wrap-Up
Free daily emails: the day's strongest setups before the open, and how they did after the close.
Install it like an app
Add MoSoG to your phone or desktop home screen in one tap: full-screen and fast, no app store needed.
Performance dashboard
Win rate, average return, time in trade and a per-scan breakdown: the full track record, in-app.
Refer & earn
Join the affiliate program: share your link, track clicks and sign-ups, and get paid out.
Sign up now and try it free for 7 days.
No credit card required. No risk. Just better trades.
Start Free Trial →