Options dealers sit on the other side of a huge number of trades, and they usually try to stay neutral. To do that, they buy and sell stock as prices move. Gamma exposure, or GEX, estimates how much of that hedging may be waiting at each price. It is one of the most useful ideas an options trader can learn.
What is gamma?
Delta tells you how much an option's price changes when the stock moves $1. Gamma tells you how quickly delta itself changes. High gamma means a dealer's position shifts fast, so they need to hedge more as price moves.
What gamma exposure measures
GEX adds up gamma across option contracts at each strike, using open interest and an assumption about who holds what. The result is an estimate of how dealers may be positioned.
Positive and negative gamma
- Positive gamma: dealers tend to sell as price rises and buy as it falls. That can dampen moves, so markets may feel calmer and range-bound.
- Negative gamma: dealers tend to sell as price falls and buy as it rises. That can amplify moves, so markets may feel faster and more volatile.
Key levels on a GEX heat map
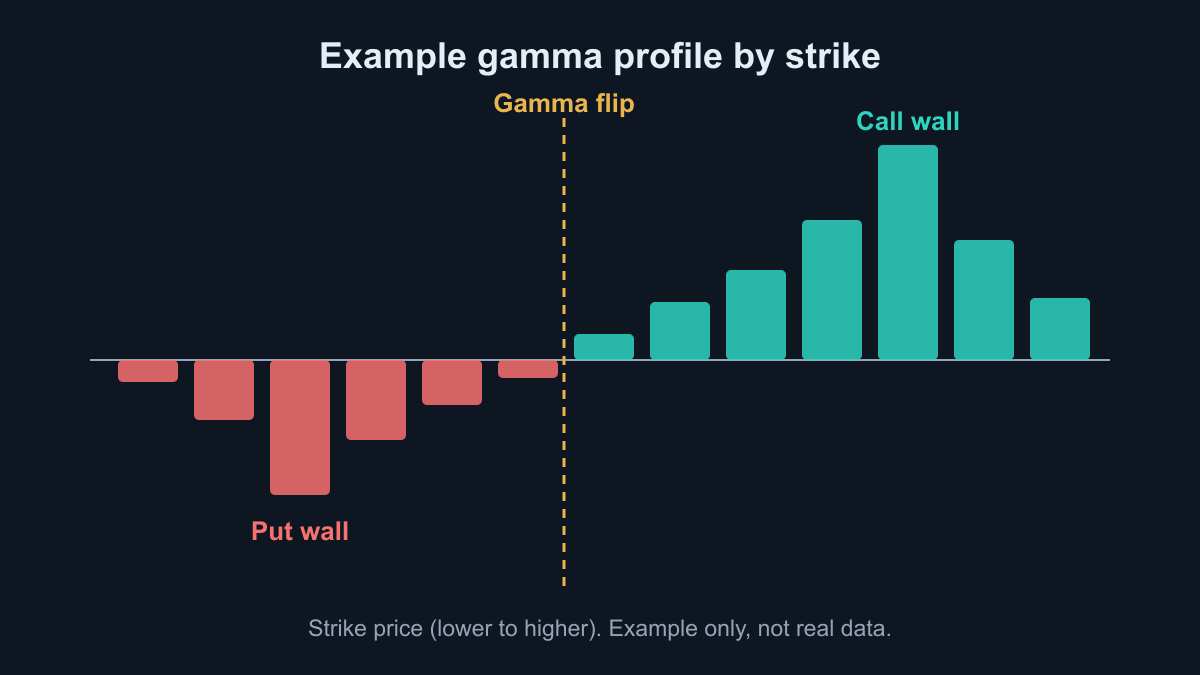
- Call wall: a strike with heavy call gamma, which often acts as resistance.
- Put wall: a strike with heavy put gamma, which often acts as support.
- Gamma flip: the approximate price where overall dealer gamma changes from positive to negative. Trading on either side can suggest a different kind of day.
How traders use it
- Check which side of the gamma flip price is on, to set expectations for the day.
- Mark the nearest call wall and put wall as areas to watch.
- Look at which expirations hold the most gamma, since near-term contracts matter most.
- Combine it with your own chart and your own risk plan.
The limits of GEX
GEX is an estimate. Public data does not reveal exactly who owns each contract, so any model has to make assumptions. Open interest also updates only once a day, while positions change constantly. A wall is an area to watch, not a guarantee, and major news can run straight through any level.
Dealer maps on My Own Stock Guru
Our GEX and VEX heat maps show dealer gamma and vega by strike for SPY, QQQ, IWM and DIA, refreshed daily after the close. Each comes with call and put walls, the gamma flip, a per-expiration breakdown and a plain-English read of the setup. They are included with the Trader and Elite plans and available as an add-on for Starter. See pricing or the full feature list.
Sources and further reading
This article is educational and is not investment advice.